Archive for the ‘Water Ressources’ tag
How Much Oil Has Flown into The Gulf of Mexico?
It might be highly uncertain, but some people thing that about four million (4,000,000) liters of liquid (or whatever it is classified as) flow out of the hole of the BP drilling – per day.
Certainly, that’s a big number, but how does it compare to other numbers?
beer: Germans like beer, and drink a lot. On average between 1991 and 1999 about 11.6 Million liters – per year! That means, that a volume equivalent of the annual beer production of Germany gushes into the Gulf of Mexico in three days
manure: I recently visited a company called “Eisele” that builds agricultural equipment. Among other things an unbelievably huge tank wagon.

About 20,000 liters fit into such a tanker wagon
About 20,000 liters fit into such a vehicle. If you do the math, you’ll realize that every day the contents of 200 such waggons pour into the Gulf! 8 per hour! 1 every 7 minutes!
Mind you this is happening now since 5 weeks! That’s the beer production of Germany of 12 years! For the zoo of the city of Nuernberg, since many years, the city is trying to build a huge tank for dolphins. Let’s say comparable to sea world. However, they plan it to be so huge, that it costs too much money, and hasn’t been built completely. Using the numbers in this pdf, the volumes of about 26 such incredibly expensive “dolphin tanks” have been dumped into the Gulf. It’s still mind-boggling.
update Friday; June 4, 2010:
- There is a NYTimes article from early may that states the daily volume of oil that gushes into the Gulf of Mexico is 5,000 barrels which equates to 587,000L which is 6.8 times less than the 4 million liters.
- The Exxon Valdez Oil spill caused 11 million barrels of oil to destroy the environment (source), which equates to 41,640,000 liters. If you take the 4 million liters a day as the flow rate of the Gulf’s current leak, then you would have an Exxon Valdez every 10 days, we’re at least in week 6, that’s about 4 Exxon Valdez so far.
Just Enough
I just read through a wonderful book. Wonderful refers to both its content as to the way it is made, designed, and illustrated. The book is called “Just Enough: Lessons in Living Green from Traditional Japan“
The book is about the Edo Period, which is a period in Japan’s history when ‘the mentality of the time found meaning and satisfaction in a life in which the individual took just enough from the world, and no more’. This is a fascinating approach, and as the author points out, difficult to judge for any of us who has never lived in a mostly self-sustaining society.
we will need to learn again what it means to use ‘just enough’, and to allow our choices to be guided by a deeper appreciation of the limits of the world we have been bequeathed as well as a determination to leave future generations with better possibilities than what we have given ourselves.
A central element necessary for this self-sustainability was the concept of re-use. The book is full of descriptions of how everything was used over and over again, and if something was not good for anything at all anymore, it was used to be burned for heat. The book illustrates clearly, how the concept of re-use propagated through design decisions for every little detail: the architecture of houses, the surroundings of houses, the planning of the city, how water is used, how food is used including how most people were vegetarians, or how manure was a precious resource and was collected in cities to be used as fertilizer on farm land. This went so far, that people with many children hat to pay less rent, because they provided so much fertilizer.
The movie “Plastic Planet”, about which I blogged, demonstrated clearly that our current society doesn’t re-use many things at all, and pointed out clearly that very soon we people on planet earth have to re-learn how to re-use things very quickly. From the view of “society”, there is also a relation to an article in the german paper TAZ, entitled “Ungleichheit zersetzt Gesellschaften“, which presents a study that showed that people live happier in countries with more equal opportunities, such as Japan (sic!)
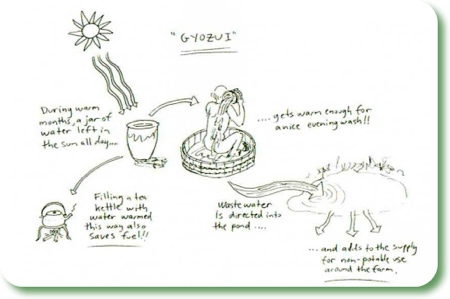
Preserving water in traditional Japan
Here is the interesting part which is especially related to this blog: The people in Edo-Period Japan had realized that especially the resource clean water is very critical for their self-sustainability. Methods and designs for preserving water appeared in every facet of daily life:
- it was known that forests plays a critical role for storing water that is released over summer from glaciers at the high mountains. Hence forests determine the availability of water during the summer months. Hence they need to and were protected;
- for the cities, water sources such as rivers and ponds were protected for drinking water supply, and the people realized that people far away need to make sakrifices for source water protection in order to facilitate supply in cities via aqueducts;
- water in these aqueducts was mostly kept flowing by gravity, which required very sophisticated design — and allowed flowing water in all parts of the city 24/7, almost a luxury and unknown to european cities of the time.
Here is another review of “Just Enough”.
Two Slides: Water Costs and Correlation of GDP with Precipitation
The IAHR student chapter at the University of Stuttgart recently held a colloquium on “Social, Economic and Political Perspective of Water”.
At this colloquium, Dr. Ulrike Pokorski da Cunha gave a presentation entitled “Nexus: Poverty–Water–Development”. Two of her slides were the ones that stuck in my head. I will show them in this post. Mrs. Pokorski da Cunha works for the “Deutsche Gesellschaft für Technische Zusammenarbeit” (GTZ), a federally owned institution that supports the German government in achieving its development-policy objectives on a technical level, in the “water policy” branch.
The first slide shows how different sources of water (on the x-axis) cost a different prize (y-axis). There can be made the distinction between public and private supply and between piped and unitized supply. The most cost efficient water supply is public water supply in a piped network. The most expensive water supply is if you need carters. The source of this chart is the PPIAF database
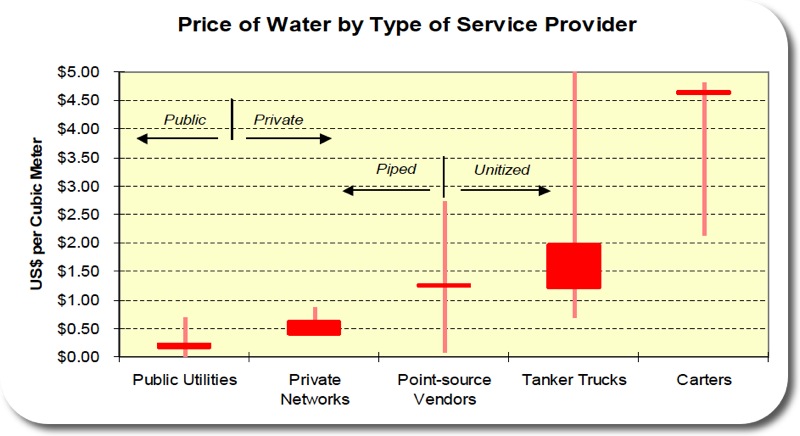
Poor People Pay More for Worse Water
The second slide I want to share shows how the economy of Zimbabwe is affected by precipitation. The line underlain by yellow shading represents the positive or negative change in GDP for Zimbabwe. The dark blue line represents the change in precipitation relative to the long term average of precipitation. This line is positive, if it rains more than on average and this line is negative, if it rains less than on average. Both line correlate well: Generally, if it rains a lot, the economy is doing well, if it rains little, the economy performs poorly.
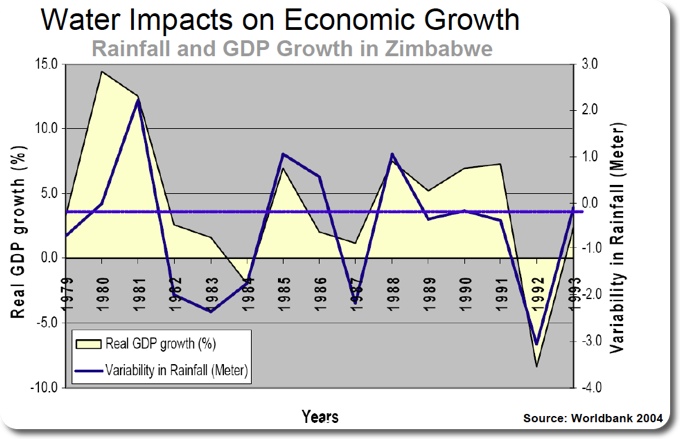
Precipitation Impacts on Economic Growth
Thanks Ulrike Pokorski da Cunha for allowing me to share those two slides!
Garbage in the Oceans
I have written in the past about garbage in the world’s oceans (here and here).
About a week ago, the New York Times has a story that is extremely moving in my opinion on that topic. In short, two thoughts just blow my mind:
- “the Pacific garbage patch, an area of widely dispersed trash that doubles in size every decade and is now believed to be roughly twice the size of Texas“.
- The biggest problem of the garbage is plastic: “… when a predator — a larger fish or a person — eats the fish that eats the plastic, that predator may be transferring toxins to its own tissues, and in greater concentrations since toxins from multiple food sources can accumulate in the body”.
Bohrunfall in Wiesbaden
Bei Bauarbeiten am Finanzministerium in Wiesbaden ist es zu einem spektakulären Unfall gekommen: unerwartet wurde ein gespannter Grundwasserleiter angebohrt. Das unter Druck stehende Wasser bahnte sich seinen Weg durch das Bohrloch nach oben, was in einer relativ imposanten Fontäne resultierte:
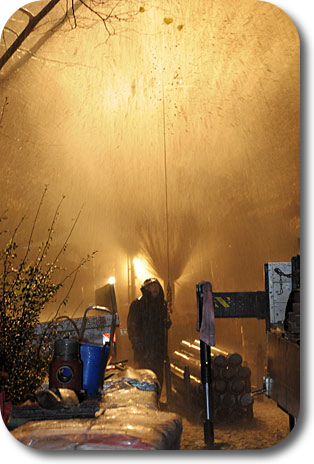
Das Wiesbadener Tagblatt berichtet hier und hier. Siehe auch Berichte in der Sueddeutschen und vom Hessischen Rundfunk. Interessant ist dass bei spaeteren Meldungen von einer “Wasserblase” die Rede ist, und nicht mehr von einem gespannten Grundwasserleiter.
Hier ist eine Fotostrecke.
Ist jemand vor Ort und kann Erfahrungen schildern?
Prizes: Nobel in Economics, Right Livelihood, Tragedy of the Commons
Nobel Prize in Economics
update Thursday; October 29, 2009: here is an overview-article, “The Non-Tragedy of the Commons”. It deals like my post with Hardin’s paper, it includes additional references to Elinor Ostrom’s work, and it shows solutions how the commons can be managed well.
The Nobel Price in Economics has been awarded this year to Elinor Ostrom. Besides being the first woman who has been awarded the Nobel Price in economics, she is also the first environmental economist. The Nobel Committee explains its choice for her due to her research on “problems related to the use of commons such as fishing grounds, groundwater resources, forests and pastures”.
According to The Globe and Mail,
Dr. Ostrom’s research, and her celebrated publication, Governing the Commons
, challenged the prevailing wisdom that the best way to manage something is to privatize it or regulate it.
I haven’t read any of her works, in fact I haven’t heard of hear until this morning. However, the reasoning of the Nobel committee reminded me of probably one of the top five scientific papers I have read in my university career, at a very unlikely place. I once took a course entitled “ecological engineering”, given by Allan Werker who now seems to be at a company called anoxkaldnes. In this course we spent quite some time reading and discussing the paper “The Tragedy of the Commons” by Garrett Hardin. Back then this article sparked some of the most vivid discussions I have ever had in an engineering class, including some interesting modelling exercises with BerkeleyMadonna.
Right Livelihood Award
On a related note and since it seems to be award-season, I want to point out that the right livelihood awards 2009 have been awarded to David Suzuki, René Ngongo, Alyn Ware, and Catherine Hamlin.
David Suzuki is an interesting person, has great speaking and writing skills, and has undertaken a lot of action in his life to make the world a better place. His autobiographyis a remarkable read.
Even more remarkable is a speech given by his daughter to the assembly of the UN. She’s known in YouTube as the “Girl who Silenced the UN for 5 Minutes”:
I promise to continue to post on correlation examples really soon!
Tipping Point Crossed for “Planetary Boundaries”
Twenty-eight scientists published the concept of a “safe operating space for humanity” in “Nature” two days ago. Here’s the description of what this operating space is, straight from their paper:
To meet the challenge of maintaining the Holocene state, we propose a framework based on ‘planetary boundaries’. These boundaries define the safe operating space for humanity with respect to the Earth system and are associated with the planet’s biophysical subsystems or processes. Although Earth’s complex systems sometimes respond smoothly to changing pressures, it seems that this will prove to be the exception rather than the rule. Many subsystems of Earth react in a nonlinear, often abrupt, way, and are particularly sensitive around threshold levels of certain key variables. If these thresholds are crossed, then important subsystems, such as a monsoon system, could shift into a new state, often with deleterious or potentially even disastrous consequences for humans.
The figure below is used to illustrate their concept:
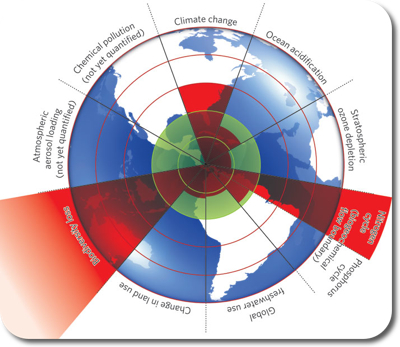
The inner green shading represents the proposed safe operating space for nine planetary systems. The red wedges represent an estimate of the current position for each variable. The boundaries in three systems (rate of biodiversity loss, climate change and human interference with the nitrogen cycle), have already been exceeded.
It should be noted, that their analysis is based on data, even though I haven’t found a clear description how they calculated the distance away from the tipping point. Here is some more detailed description from their paper
Three of the Earth-system processes — climate change, rate of biodiversity loss and interference with the nitrogen cycle — have already transgressed their boundaries. [This transgression] cannot continue without significantly eroding the resilience of major components of Earth-system functioning. Here we describe these three processes.
Although the planetary boundaries are described in terms of individual quantities and separate processes, the boundaries are tightly coupled. We do not have the luxury of concentrating our efforts on any one of them in isolation from the others. If one boundary is transgressed, then other boundaries are also under serious risk. For instance, significant land-use changes in the Amazon could influence water resources as far away as Tibet. The climate-change boundary depends on staying on the safe side of the freshwater, land, aerosol, nitrogen–phosphorus, ocean and stratospheric boundaries. Transgressing the nitrogen–phosphorus boundary can erode the resilience of some marine ecosystems, potentially reducing their capacity to absorb CO2 and thus affecting the climate boundary.
It seems like a good idea to promote the idea that we have to take care of many tipping points at the same time. It seems even more important to stress non-linear behaviour and non-reversible behaviour. This is nothing new, but it is important to stress such important things once in a while. If a contaminant plume was reversible much of our subsurface remediation problems would be solved quite easily. However, there is dispersion, and hence a plume cannot be reversed. A similar example, related to the contamination of a lake, is given by Shahid Naeem, as quoted by Carl Zimmer:
A lake, for example, can absorb a fair amount of phosphorus from fertilizer runoff In five areas, the scientists found, the world has not yet reached the danger threshold. without any sign of change. ‘You add a little, not much happens. Add a little more, not much happens. Add a little… then, all of sudden, you add a little more and — boom! — phytoplankton bloom, oxygen depletion, fish die-off, smelliness. Remove the little phosphorus that caused the tipping of the system, and it does not reverse. In fact, you have to go back to much cleaner water than you would have imagined.
To conclude, it seems like a neat idea to establish such indicators that seem to tell us in what areas we are doing ok and in what other areas we exceeded the threshold. However such a compartmented visualization seems to contradict the intention of the authors when they write how they had coupling of the compartments in mind.
Where does this leave us on an operational level? Are those guys going to publish their indicator-levels every half year from now on, and then we can see the areas where we improved and where things got worse? Could we even narrow all human activities down to one indicator? If not, then why those seven? And how come we exceeded the outer limit of earth for “Biodiversity loss” while we’re only one step outside the green zone for climate change?
It remains to be noted, that both ” Atmospheric aerosol loading” as well as “Chemical Pollution” are not yet quantified and it is not clear as to why they are not yet quantified.
Further resources
- The Stockholm Resilience Centre, where the lead author Johan Rockström is based at;
- An editorial at Nature;
- Commentaries by “seven experts” (one for each category)
- discussion at wired.com
A safe operating space for humanity Johan Rockström, Will Steffen, Kevin Noone, Åsa Persson, F. Stuart Chapin, III, Eric F. Lambin, Timothy M. Lenton, Marten Scheffer, Carl Folke, Hans Joachim Schellnhuber, Björn Nykvist, Cynthia A. de Wit, Terry Hughes, Sander van der Leeuw, Henning Rodhe, Sverker Sörlin, Peter K. Snyder, Robert Costanza, Uno Svedin, Malin Falkenmark, Louise Karlberg, Robert W. Corell, Victoria J. Fabry, James Hansen, Brian Walker, Diana Liverman, Katherine Richardson, Paul Crutzen & Jonathan A. Foley Nature 461, 472-475(24 September 2009) doi:10.1038/461472a
Jacob Bear Short Course – Day 4
The course is over. Instead of blogging immediately about day 4, I spent the evening in Torino and hung out with some people from the course. At this point I have to point out how nice the city of Torino is, how nice and willing to help the people are. In the town, during the days of my visit, I was asked at least three independent times, if I needed help! On the final evening, we sat down on a bench on one of the plazas, and an elderly man started to talk to us in Italian, slowly and very well understandably. He ended up walking with us through the old city four over an hour and pointed out places of interest. It was just wonderful!
On the last day we covered heat transport and transport with fluids of variable density, especially sea water intrusion. From a historical point of view it’s interesting that because of sea water intrusion, density dependent models were the first “contamination” models to be developed. That is before dispersion was developed, and hence sea water intrusion was treated with sharp interfaces. We learned about the “Hele Shaw Model“, which Jacob Bear has used to model sea water intrusion before the use of computers was feasible. Bear developed during his M.Sc. thesis a horizontal Hele Shaw model. His first bookhas a full section on constructing Hele Shaw models. The idea seems from a former time, but such a model could have its uses for education!
In the afternoon, Dr. Rajandrea Sethi gave a presentation on how his group models colloid- and nano-particle transport under saturated conditions.
These were just amazing four days in Torino. It was such an interesting approach – to hear essentially a short but complete version of porous media theory in four days. Jacob Bear as teacher for this short course was amazing. Every word he uses has a meaning, everything he says builds up consecutively, and he stresses the important points. I will have many ideas to write about in the next little while for sure! 🙂
Jacob Bear Short Course – Day 3
I had an epiphany today. It has to do with dispersion. If you are at a scale, where you look at little pieces of solids which have either and / or air around them. Let’s call this microscopic scale. Say, you are trying to describe how a solute moves by advection on that scale, then you would do this by a term that represents the velocity of the fluid times the concentration of the solute. Now, if you want to go one scale up, to a “macroscopic” scale. Then you have to average. It turns out, that the result of this averaging are two terms, both represent a velocity times a concentration, but one is the advective flux from before, and the other one is a dispersive flux.
When I heard this this morning for the first time I though, ok, fair enough, but where’s the dispersion tensor coming in? There are two parts to this answer. (1) dispersion has at the “beginning” been called “mechanical spreading” — a phenomenon that is caused by pure fluid mechanics. (2) the dispersion tensor comes only in when people realized, that this second part that arose when averaging solute advection from microscale to macroscale, can be described by a constant times a gradient of the solute’s concentration. Tata, and the constant is the dispersion tensor, the entries of which are the dispersivities times the velocity. The discussion of what dispersivities are and how they relate to each other is a whole other story.
And it turns out that the dispersivities in non-isotropic cases are actively researched, foremost by Jacob Bear himself, “30 to 40 years” after he dealt with dispersion for the first time!
Note: I have no idea, what exactly arxiv.org does, I want to point out what I wrote in the impressum, that is that I am not responsible to content of sites I link to (disclaimer), however both current articles by Jacob Bear are available on arxiv.org, that is (see here and here).
Jacob Bear Short Course – Day 1
As I mentioned before, I am currently attending a short course presented by Jacob Bear. The first day with ~6 hours of lecturing is over. These hours were some of the fastest lecturing hours I’ve experienced in my academic life to date. As I can tell so far, the advantages of such an experienced lecturer are:
- He has explained these things many times before, so he knows where he is coming from and where he’s going to;
- This experience is also clear in the way he explains things — he knows what to emphasize;
In terms of his lecturing style I like
1) that he stresses things clearly either by pointing them out directly or by repeating them. The repetition might be directly after the first time he mentions something, or the repetition might be some significant amount of time after the first mention;
2) the clearness how things evolve. At any point it is clear why we are discussing what we are discussing and where we are coming from. Mostly it is even clear where we are going to;
3) The way of his explanations. Usually the explanation evolves from a usually very basic question. How basic the questions are is sometimes startling. However, the answers to such seemingly simple questions provide quite a bit of insight:
- What is a porous medium?
- What is a continuum approach?
- What is a phase, what is a component?
- Why do we not solve “flow” with the Navier-Stokes equation? After all, we do know essentially everything at a macroscopic level!
- What is a model?
- What is a fluid? — The abstraction of “fluid” from “molecules” is a very nice comparison with the deduction of a REV!
- What is a water table? — If I learned one thing at Waterloo, I think I would choose this 🙂
After these basic definitions, also including a discussion of modelling and the modelling process, we spent a lot of time of deriving the advection-dispersion equation, from two angles. – from a Darcy-angle and – from a momentum-equation angle.
The beautiful thing was how Jacob Bear showed, from first principles how the advection-dispersion equation is obtained under which assumptions. Again, this is nothing new, but new was at what basic level we started. Some of the averaging techniques Jacob Bear briefly showed us, and which were written down by Bear and Bachamat (1990), might deserve some deeper investigation.
Also interesting is the concept to derive basic equations for any extensive quantity, add the above mentioned averaging rules, and substitute the desired quantity and you’re desired description is right there. Nice.
Tomorrow, we’ll be dealing with one of my current favourite topics, dispersion.