Two Slides: Water Costs and Correlation of GDP with Precipitation
The IAHR student chapter at the University of Stuttgart recently held a colloquium on “Social, Economic and Political Perspective of Water”.
At this colloquium, Dr. Ulrike Pokorski da Cunha gave a presentation entitled “Nexus: Poverty–Water–Development”. Two of her slides were the ones that stuck in my head. I will show them in this post. Mrs. Pokorski da Cunha works for the “Deutsche Gesellschaft für Technische Zusammenarbeit” (GTZ), a federally owned institution that supports the German government in achieving its development-policy objectives on a technical level, in the “water policy” branch.
The first slide shows how different sources of water (on the x-axis) cost a different prize (y-axis). There can be made the distinction between public and private supply and between piped and unitized supply. The most cost efficient water supply is public water supply in a piped network. The most expensive water supply is if you need carters. The source of this chart is the PPIAF database
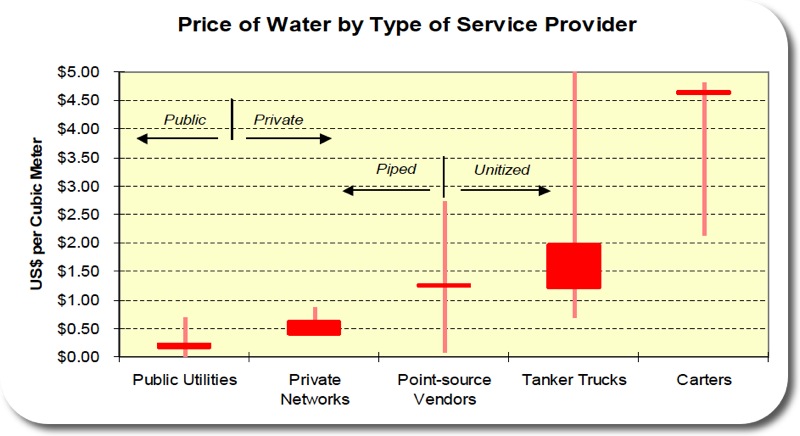
Poor People Pay More for Worse Water
The second slide I want to share shows how the economy of Zimbabwe is affected by precipitation. The line underlain by yellow shading represents the positive or negative change in GDP for Zimbabwe. The dark blue line represents the change in precipitation relative to the long term average of precipitation. This line is positive, if it rains more than on average and this line is negative, if it rains less than on average. Both line correlate well: Generally, if it rains a lot, the economy is doing well, if it rains little, the economy performs poorly.

Precipitation Impacts on Economic Growth
Thanks Ulrike Pokorski da Cunha for allowing me to share those two slides!