Archive for the ‘Precipitation’ tag
Two Slides: Water Costs and Correlation of GDP with Precipitation
The IAHR student chapter at the University of Stuttgart recently held a colloquium on “Social, Economic and Political Perspective of Water”.
At this colloquium, Dr. Ulrike Pokorski da Cunha gave a presentation entitled “Nexus: Poverty–Water–Development”. Two of her slides were the ones that stuck in my head. I will show them in this post. Mrs. Pokorski da Cunha works for the “Deutsche Gesellschaft für Technische Zusammenarbeit” (GTZ), a federally owned institution that supports the German government in achieving its development-policy objectives on a technical level, in the “water policy” branch.
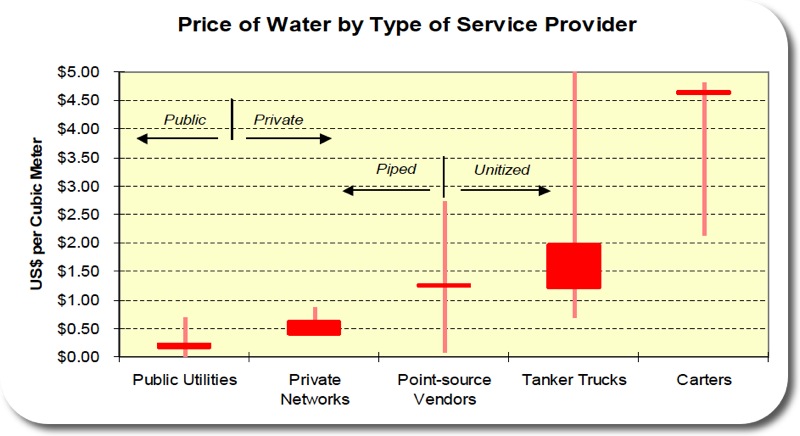
The first slide shows how different sources of water (on the x-axis) cost a different prize (y-axis). There can be made the distinction between public and private supply and between piped and unitized supply. The most cost efficient water supply is public water supply in a piped network. The most expensive water supply is if you need carters. The source of this chart is the PPIAF database
Poor People Pay More for Worse Water
The second slide I want to share shows how the economy of Zimbabwe is affected by precipitation. The line underlain by yellow shading represents the positive or negative change in GDP for Zimbabwe. The dark blue line represents the change in precipitation relative to the long term average of precipitation. This line is positive, if it rains more than on average and this line is negative, if it rains less than on average. Both line correlate well: Generally, if it rains a lot, the economy is doing well, if it rains little, the economy performs poorly.

Precipitation Impacts on Economic Growth
Thanks Ulrike Pokorski da Cunha for allowing me to share those two slides!
Local Water News – Extreme Events!
The Stuttgarter Zeitung recently published two articles related to water:
The first article describes the flood-protection measures for a part of the city of Tübingen. The city council just agreed to start building a dam in 2010. This dam will be able to stand in a flood with a 20-year return period.
A normally relatively small creek, the “Goldersbach“, has lead in the past after extreme precipitation events to extensive flooding and related destruction. The dam is part of a multiple-level protection strategy, which is outlined in this publication. The dam is a good thing, however it won’t withstand any substantial floods, that is floods bigger than with a 20-year return period. This is why the warning time is critical for the citizens living in the area! The article states that the warning time is five hours. It would be interesting to get to know details on how they estimate five hours as the warning time. Measurements have to be made, submitted, and calculations and predictions have to be made, involving fair amounts of uncertainty.
The second article describes how NASA researchers found out while working with GRACE data that groundwater levels are declining in India since 2002, even though the precipitation patterns have been fairly normal.
These are two practical examples that illustrate how extreme events are critical and need special attention!
Rain on Saturdays
Air temperatures in Germany vary with a weekly cycle: wednesdays are the warmest days, saturdays the coldest. These results were produced by Bernhard Vogel and Dominique Bäumer at the University of Karlsruhe, Germany, as is reported by Die Tageszeitung. They point out that this is not a local phenomenon, since they found the same phenomenon at fairly remote stations, in the German Alps for example. Additionally they argue that such a strict weekly phenomenon could not originate in nature, and they blame little particles in the air (aerosols) that are emitted mostly during work-days from factories and traffic. Similar results were subsequently found in China and in the USA.

Rain on Saturday
Die Tageszeitung proceeds to describe how this is not unanimously accepted in the scientific community. Harrie-Jan Hendricks Franssen from the ETH Zürich. He compared Swiss data from Zürich and Lugano with the German data used by Vogel and Bäumer, trying to figure out if precipitation and temperature behaved similarly in Switzerland as in Germany as reported by Vogel and Bäumer. Lugano is south of the Alps and hence should be influenced from different weather mechanismns than Germany. Additionally, Lugano is located in the vicinity of Milano, which exhibits Smog frequently.
Both Lugano and Zurich never showed a persistent weekly cycle for precipitation and sunshine duration for the investigated period. In addition, only 4 of the calculated 28 anomalies for the period 1991 – 2005 (2 stations x 2 variables x 7 weekdays) were statistically significant (statistically 1.4 anomalies are expected). Only one of the four statistically significant anomalies had the same sign as observed by BV07. The anomalies were analyzed further in a Monte Carlo study. The stochastic simulation experiments suggest that none of the anomalies was significant; even the largest anomaly (the anomaly of Saturday precipitation in Zurich of 18.0%) occurred in 9% of the experiments due to purely random effects. In addition, for 21% of the stochastic experiments a weekly cycle in precipitation in Zurich is found due to random effects.
Vogel and Bäumer respond on Hendrick’s finding in a comment published also in the Geophysical Research Letters. Die Tageszeitung points out that there are additional studies being conducted in Spain and in the USA, all to evaluate the role that aerosols in the air play related to weather. It’s great to see that sometimes research is well published in newspapers for the public!
Measuring Rain
Measuring how much rain falls during a given time, the meteorological parameter “rainfall intensity”, is difficult to measure. It gets even more difficult if the goal is to measure the spatial distribution of rainfall, and how it changes over time.

The Convective and Orographically-induced Precipitation Study (COPS) will try and use different new remote sensing techniques and proven ground based or air borne techniques such as lidars, radars, precipitation detectors. Obviously over a large are, the Black Forrest in south-west Germany. The german news station ZDF has quite an enthusiastic report on this measurement-campaign and the improvement the scientists will gain for mathematical weather forecasting.