Tipping Point Crossed for “Planetary Boundaries”
Twenty-eight scientists published the concept of a “safe operating space for humanity” in “Nature” two days ago. Here’s the description of what this operating space is, straight from their paper:
To meet the challenge of maintaining the Holocene state, we propose a framework based on ‘planetary boundaries’. These boundaries define the safe operating space for humanity with respect to the Earth system and are associated with the planet’s biophysical subsystems or processes. Although Earth’s complex systems sometimes respond smoothly to changing pressures, it seems that this will prove to be the exception rather than the rule. Many subsystems of Earth react in a nonlinear, often abrupt, way, and are particularly sensitive around threshold levels of certain key variables. If these thresholds are crossed, then important subsystems, such as a monsoon system, could shift into a new state, often with deleterious or potentially even disastrous consequences for humans.
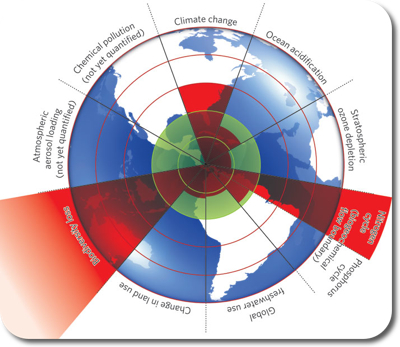
The figure below is used to illustrate their concept:

The inner green shading represents the proposed safe operating space for nine planetary systems. The red wedges represent an estimate of the current position for each variable. The boundaries in three systems (rate of biodiversity loss, climate change and human interference with the nitrogen cycle), have already been exceeded.
It should be noted, that their analysis is based on data, even though I haven’t found a clear description how they calculated the distance away from the tipping point. Here is some more detailed description from their paper
Three of the Earth-system processes — climate change, rate of biodiversity loss and interference with the nitrogen cycle — have already transgressed their boundaries. [This transgression] cannot continue without significantly eroding the resilience of major components of Earth-system functioning. Here we describe these three processes.
Although the planetary boundaries are described in terms of individual quantities and separate processes, the boundaries are tightly coupled. We do not have the luxury of concentrating our efforts on any one of them in isolation from the others. If one boundary is transgressed, then other boundaries are also under serious risk. For instance, significant land-use changes in the Amazon could influence water resources as far away as Tibet. The climate-change boundary depends on staying on the safe side of the freshwater, land, aerosol, nitrogen–phosphorus, ocean and stratospheric boundaries. Transgressing the nitrogen–phosphorus boundary can erode the resilience of some marine ecosystems, potentially reducing their capacity to absorb CO2 and thus affecting the climate boundary.
It seems like a good idea to promote the idea that we have to take care of many tipping points at the same time. It seems even more important to stress non-linear behaviour and non-reversible behaviour. This is nothing new, but it is important to stress such important things once in a while. If a contaminant plume was reversible much of our subsurface remediation problems would be solved quite easily. However, there is dispersion, and hence a plume cannot be reversed. A similar example, related to the contamination of a lake, is given by Shahid Naeem, as quoted by Carl Zimmer:
A lake, for example, can absorb a fair amount of phosphorus from fertilizer runoff In five areas, the scientists found, the world has not yet reached the danger threshold. without any sign of change. ‘You add a little, not much happens. Add a little more, not much happens. Add a little… then, all of sudden, you add a little more and — boom! — phytoplankton bloom, oxygen depletion, fish die-off, smelliness. Remove the little phosphorus that caused the tipping of the system, and it does not reverse. In fact, you have to go back to much cleaner water than you would have imagined.
To conclude, it seems like a neat idea to establish such indicators that seem to tell us in what areas we are doing ok and in what other areas we exceeded the threshold. However such a compartmented visualization seems to contradict the intention of the authors when they write how they had coupling of the compartments in mind.
Where does this leave us on an operational level? Are those guys going to publish their indicator-levels every half year from now on, and then we can see the areas where we improved and where things got worse? Could we even narrow all human activities down to one indicator? If not, then why those seven? And how come we exceeded the outer limit of earth for “Biodiversity loss” while we’re only one step outside the green zone for climate change?
It remains to be noted, that both ” Atmospheric aerosol loading” as well as “Chemical Pollution” are not yet quantified and it is not clear as to why they are not yet quantified.
Further resources
- The Stockholm Resilience Centre, where the lead author Johan Rockström is based at;
- An editorial at Nature;
- Commentaries by “seven experts” (one for each category)
- discussion at wired.com
A safe operating space for humanity Johan Rockström, Will Steffen, Kevin Noone, Åsa Persson, F. Stuart Chapin, III, Eric F. Lambin, Timothy M. Lenton, Marten Scheffer, Carl Folke, Hans Joachim Schellnhuber, Björn Nykvist, Cynthia A. de Wit, Terry Hughes, Sander van der Leeuw, Henning Rodhe, Sverker Sörlin, Peter K. Snyder, Robert Costanza, Uno Svedin, Malin Falkenmark, Louise Karlberg, Robert W. Corell, Victoria J. Fabry, James Hansen, Brian Walker, Diana Liverman, Katherine Richardson, Paul Crutzen & Jonathan A. Foley Nature 461, 472-475(24 September 2009) doi:10.1038/461472a