Spaghetti Plots with LineSegments in Matplotlib
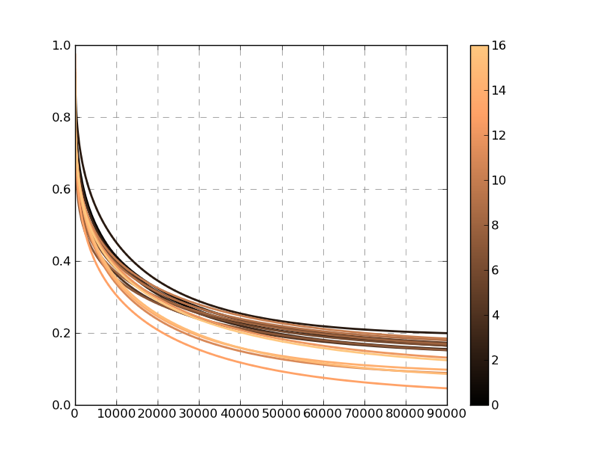
I recently found out about “LineSegments” in Matplotlib. They allow you to plot “Spaghetti-Plots” fairly easily, without looping in the figure and with comfortable assignment of properties such as color or line thickness.

def plot_LineSegements(x,
                       ys,
                       ylim=[0.0,1.0],
                       label_str='',
                       linewidth=2.0,
                       linestyle='solid',
                       cm='copper'
                       outOS=None):

# set the plot limits, they will not autoscale
ax = plt.axes()
ax.set_xlim((x.min(),x.max()))
ax.set_ylim(ylim)

# colors is sequence of rgba tuples
# linestyle is a string or dash tuple. Legal string values are
#          solid|dashed|dashdot|dotted.  The dash tuple is (offset, onoffseq)
#          where onoffseq is an even length tuple of on and off ink in points.
#          If linestyle is omitted, 'solid' is used
# See matplotlib.collections.LineCollection for more information
line_segments = LineCollection([zip(x,y) for y in ys], # Make a sequence of x,y pairs
                                linewidths    = linewidth,
                                linestyles = linestyle,
                                cmap=plt.get_cmap(cm))
line_segments.set_array(np.arange(np.array(ys).shape[0]))
ax.add_collection(line_segments)
fig = plt.gcf()
axcb = fig.colorbar(line_segments)
axcb.set_label(label_str)
ax.yaxis.grid(color='gray', linestyle='dashed')
ax.xaxis.grid(color='gray', linestyle='dashed')
ax.set_axisbelow(True)
plt.sci(line_segments) # This allows interactive changing of the colormap.
if outOS == None:
    plt.show()
else:
    plt.savefig(outOS)
    plt.clf()