Archive for February, 2011
Identi.ca Weekly Updates for 2011-02-23
- Now is the time for astroinformatics: http://ke-we.net/dqr – and XYZinformatics…! RT @arfon #
- Register now for the 2nd @BaltCICA conference "Coping with #Climate Change"; Bergen, Norway, May 11 & 12 http://t.co/hWzTKak (via @BaltCICA) #
- Guardian: What does the Arab world do when its #water runs out? http://is.gd/Qxbx7Q (via @WaterWired) #
- Wem gehört eigentlich das #Grundwasser (Spiegel Artikel, via @kriegs_recht): http://ke-we.net/dp6 #
- cool picture of constant head permeameter to determine #hydraulic #conductivity http://ke-we.net/dmo – see also here http://ke-we.net/dmp #
Permeameter Tests to Determine Hydraulic Conductivity
Towards the end of my PhD I started a little new project. After I spent the last few years with rather theoretical modelling, I return to real sand. Well, not real as in natural, but at least real as in sand out of silicate.
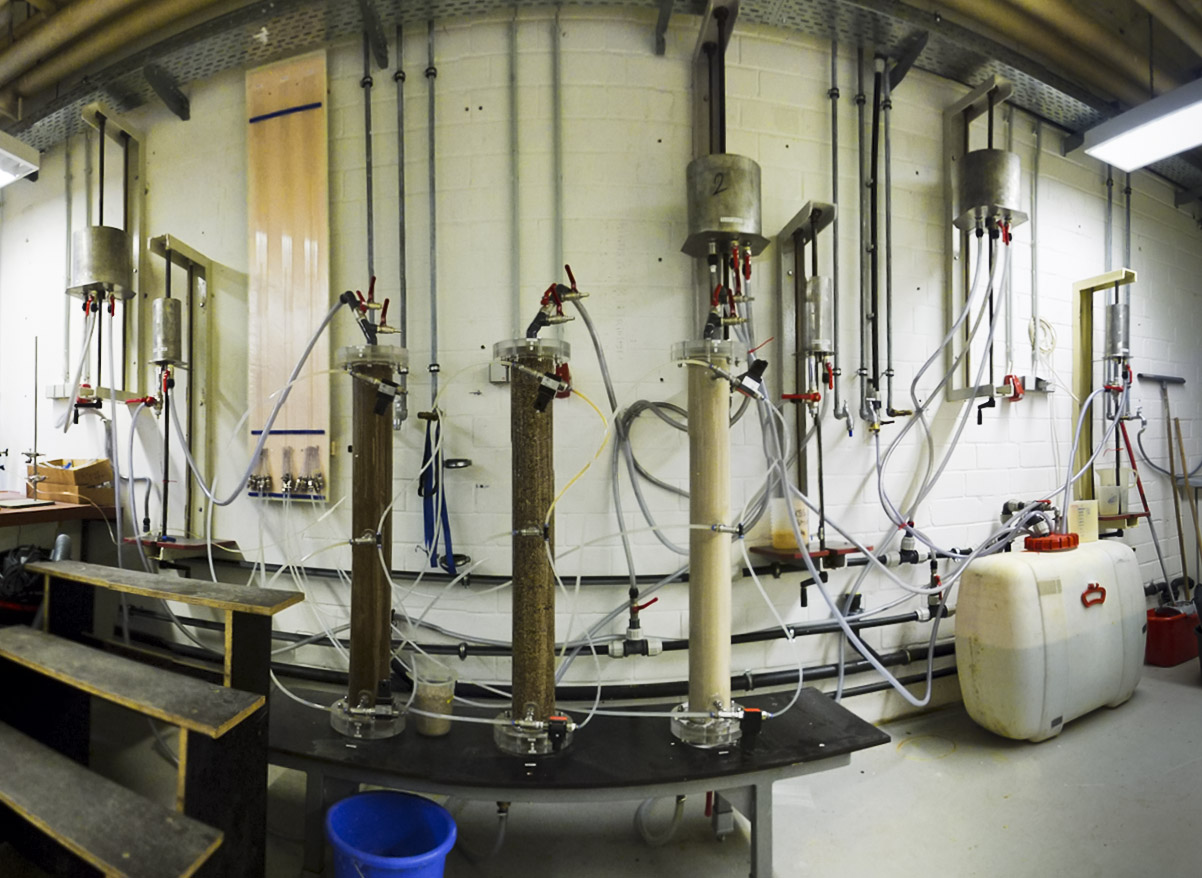
The first thing I needed to do is to find out what the values of hydraulic conductivity of some sands are. So I did my first permeameter test in a couple of years. I was used to fairly small permeameters, which were mostly used to analyze subsamples of cores. That’s what I expected when I went down into the basement of our lab. However, this is what I encountered:

It was a little weird to figure out what is going on. The three columns in the middle is where the sand is emplaced. The constant head difference between the bottom and the top of each column is adjusted by varying the hight of the silver tanks mounted to the wall (one to the left of the columns, two to the right of the columns). The three columns are communicating vessels.
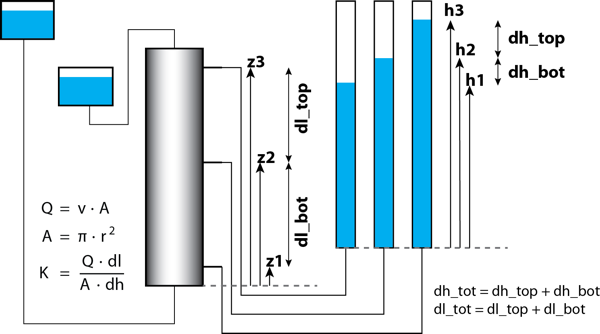
The system converted to a systematic sketch for one column looks simpler and depicts a classic Darcy experiment:

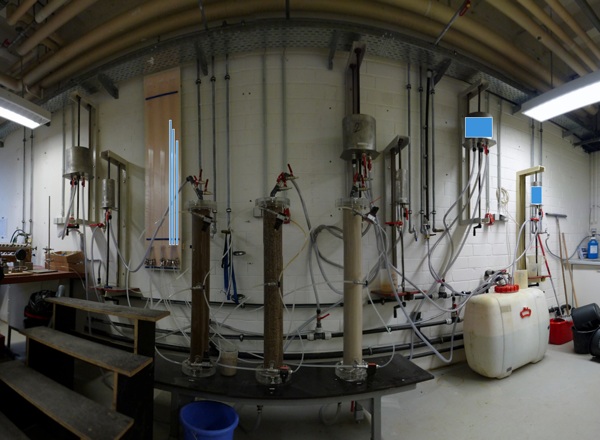
In the following image I added the water tanks that cause the constant difference in hydraulic head with the two rectangles on the right and the elevation of water in the pipes corresponding to the three outlets of the permeameter.
The fun part is, the thing work, I got three very similar measurements. Now I’m off to measuring more sands… I’ll keep you posted!

Information
I recently read at Macworld, that on our little planet we have
stored more than 295 billion gigabytes (or 295 exabytes) of data since 1986
This article at Macworld is referring to this paper published in Science by Martin Hilbert (at the University of South California) and Priscilla Lopez.
Here are a few other interesting facts:
- It was not until 2000 that digital storage made a significant contribution, contributing 25 percent to the data storage total in 2000.
- The majority of our technological memory has been in digital format since the early 2000s, with 94 percent of data stored in that format in 2007, the report indicated.
- These numbers are impressive, but still minuscule compared to the order of magnitude at which nature handles information,” Hilbert said in a statement. “Compared to nature, we are but humble apprentices. However, while the natural world is mind-boggling in its size, it remains fairly constant. In contrast, the world’s technological information-processing capacities are growing at exponential rates.”
“The Numbers Guy” Carl Bialik at WSJ picked up the same study, and has a few interesting comments, including the chart below.
- Some researchers question whether every byte is created equal. Not every pixel in the frame of a movie is essential, but each one uses storage space.
- Deciding which kinds of information to include is tricky. “If I get 10 academics in a room and ask them how much information there is, I get 20 different views”.
- To address the different ways to count information, the UCSD study breaks it down by bytes, words — counting the number of words per minute of television broadcasts or videogame play — and time spent. The older forms of media, such as books and newspapers, contribute a trivial amount of the total information consumed by Americans in 2008 in terms of bytes, but a respectable minority of the words.

Identi.ca Weekly Updates for 2011-02-16
- Cool stuff @aguanomics: John Bredehoeft on #agricultural #water use: http://bit.ly/h3BtCA and large numbers visualized: http://bit.ly/h3BtCA #
- @theAGU "tweet me in!" shiny new #hydro #list in reply to theAGU #
Identi.ca Weekly Updates for 2011-02-02
- RT @enthought: Multiple openings for Enthought #Python developers: Scientific Apps & Financial Apps: http://bit.ly/gpa6JF #NumPy #SciPy #
- beautiful video: weather vs. climate – averaging! http://ke-we.net/cc3 (via @aguanomics) #
- video of #extreme #flood in a usually small creekt: http://ke-we.net/cc2 #
- from #measuring and recording #data in the #environment to #GIS – a common and great story: http://ke-we.net/cbt #