Archive for 2012
Identi.ca Updates for 2012-08-14
Computer Codes, Reproducibility, Acceptance of Climate Models
arstechnica is having an eye on scientific magazines. In particular, two recent articles caught my eye, who report on articles from Nature and from Nature Climate Change
The Case for Open Computer Programs
The authors of this “perspective” make the point, that “without code, direct reproducibility is impossible”. The possibility to reproduce a “scientific paper’s central finding” and not the “replication of each specific numerical result down to several decimal places”. Reproducibility is part of the scientific method. I personally think that it is key to advance science. Only through understanding what others have done, we can link in our mind different concepts, which is the basis for novel thoughts.
Kyle Niemeyer points out in his article at arstechnica, that key reasons against the publication of source code are selfishness (“to slow down the competition by keeping the results of hard work to yourself”) and ideas of making money from the source code. He points to an argument by Daniel Lemire, who points out that “open sourcing […] code not only makes […] work repeatable, but spreads the ideas faster and makes the code better in the long run, since other users can help debug it.”
An important concept, also mentioned in the paper, improves reproducibility: Literate Programming, introduced by Donald Knuth. A concept that has been adapted early by Mathematica Notebooks, SWEAVE for R, or ipython notebooks for python, amongst others.
Three interesting bits from the article:
- Microsoft affirms that the treatment of floating point numbers in its popular Excel spreadsheet “…may affect the results of some numbers or formulas due to rounding and/or data truncation.”
- there are programming errors. Over the years, researchers have quantified the occurrence rate of such defects to be approximately one to ten errors per thousand lines of source code
- a study from IBM demonstrated that “fully a third of all the software failures in the study took longer than 5,000 execution years (execution time indicates the total time taken executing a program) to fail for the first time.”
 Photo by nerovivo – http://flic.kr/p/zWeRv
Communication of Climate Projections in Us Media Amid Politicization of Model Science
In this paper, the authors make a point that goes beyond reproducibility. Some models, climate models in this case, are complex which leads to hinderance of “the communication of their science, uses and limitations.”
According to the authors, this hinderance is mostly due to a lack of believe in models by the public combined with a decreasing number of mentions in the media:
- “Of those surveyed in 2010, 64% reported either that they believed that scientists’ computer models are too unreliable to predict the climate of the future (41%), or that they did not know whether to trust them (23%)”.
- The researchers first looked at articles published between 1998 and 2010 that mentioned climate change in the Wall Street Journal, New York Times, Washington Post, and USA Today. The quantity of coverage peaked in 2007, when the fourth IPCC report was released and public acceptance of climate science hit the high water mark. Yet even in 2007, climate models rarely got a mention. Over 4,000 articles (including opinion pieces) about climate change were published that year, but only 100 made reference to climate models. And that fraction continually declined through the period studied.
Scott Johnson points out in his arstechnica article, that one solution to this problem could be a public educated better in science.
Daniel Hillel
In the past, I had written about hydrogeology books, and back then I mentioned Daniel Hillel’s book “Environmental Soil Physics” for variably saturated hydrology.
I still think it is an awesome book, but I never knew much about the author — until I read today on Dot Earth about Daniel Hillel, and how he was awarded this year’s World Food Prize, mainly for his innovations related to drip irrigation in agriculture.
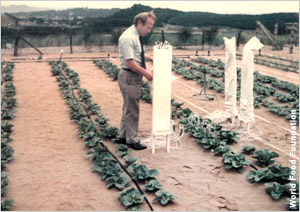
 Daneil Hillel introduced drip irrigation in Japan in 1971. Source: http://photos.state.gov/libraries/amgov/3234/week_2/06112012_WFP-IntroducingDripIrrJapan1971PR_jpg_300.jpg
Andrew Revkin on DotEarth posted a nice youtube video of a talk given by Hillel in which he points out how everything is interconnected. Based on that interconnectedness, he deduces that “we must study more and more about more and more”, and because we are limited, we need to associate and co-operate.
I like that approach! How many hydrogeologists look bewildered if they hear the soil science term “matric potential” or the expression of potentials in general. This should not be a barrier to the wonderful world of soil science, nor to the wonderful textbook by Daniel Hillel!
Congratulations!
Advantages of a Mac Server

- mercurial or git server
This is a top priority! And I can’t wait to tell you more about it. - email server
- chat server
Spaghetti Plots with LineSegments in Matplotlib
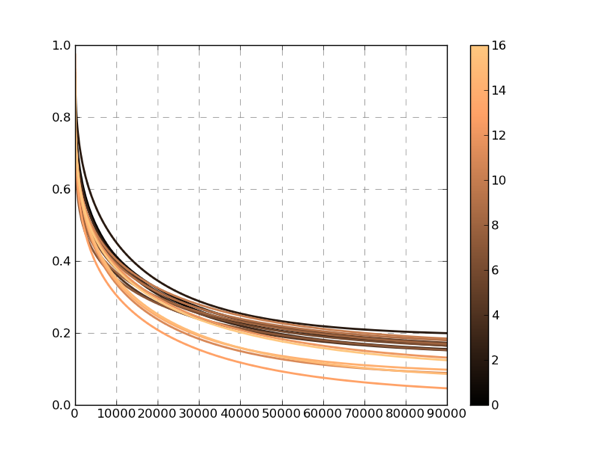
I recently found out about “LineSegments” in Matplotlib. They allow you to plot “Spaghetti-Plots” fairly easily, without looping in the figure and with comfortable assignment of properties such as color or line thickness.

def plot_LineSegements(x,
                       ys,
                       ylim=[0.0,1.0],
                       label_str='',
                       linewidth=2.0,
                       linestyle='solid',
                       cm='copper'
                       outOS=None):

# set the plot limits, they will not autoscale
ax = plt.axes()
ax.set_xlim((x.min(),x.max()))
ax.set_ylim(ylim)

# colors is sequence of rgba tuples
# linestyle is a string or dash tuple. Legal string values are
#          solid|dashed|dashdot|dotted.  The dash tuple is (offset, onoffseq)
#          where onoffseq is an even length tuple of on and off ink in points.
#          If linestyle is omitted, 'solid' is used
# See matplotlib.collections.LineCollection for more information
line_segments = LineCollection([zip(x,y) for y in ys], # Make a sequence of x,y pairs
                                linewidths    = linewidth,
                                linestyles = linestyle,
                                cmap=plt.get_cmap(cm))
line_segments.set_array(np.arange(np.array(ys).shape[0]))
ax.add_collection(line_segments)
fig = plt.gcf()
axcb = fig.colorbar(line_segments)
axcb.set_label(label_str)
ax.yaxis.grid(color='gray', linestyle='dashed')
ax.xaxis.grid(color='gray', linestyle='dashed')
ax.set_axisbelow(True)
plt.sci(line_segments) # This allows interactive changing of the colormap.
if outOS == None:
    plt.show()
else:
    plt.savefig(outOS)
    plt.clf()
Interesting Bits from ESRI / GIS
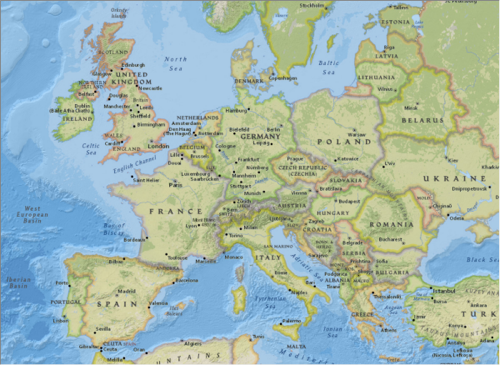
I just came across two interesting pieces related to GIS (from ESRI). The one shows how to use a National Geographic style representation of a somewhat combined political and geographical representation. The other one is a case study of a web-based tool (including some numerical groundwater modelling) for authorizing well permits.
– National Geographic style basemap: http://bit.ly/HAn3vb

– Web-based Automated Well Permitting: http://bit.ly/HAndCM
– ESRI seems to have released some elevation data, and hydrology related data, mostly in the US, and I haven’t checked (just read the blog entry) – http://bit.ly/HzXSJu
Along similar lines, Microsoft seems to have created a space/time visualization tool called “layerscape” – http://bit.ly/HzXmLE
update Thursday; June 14, 2012
there is also a new hydro base layer from ESRI
updated Wednesday; July 04, 2012
there is a worldwide net water available (precipitation – evapotranspiration) map available.
End of Abundance
“The End of Abundance: economic solutions to water scarcity” is another book about water, particularly drinking water, its shortages and associated problems. Do we need yet another book on that topic?
After I finally got around to read it, I think yes, because it offers some (to me) novel thoughts, that incorporate some basic economic thinking.
Water exists on earth in a constant amount. This amount cycles through the water-cycle at various rates. At some places the amount of available drinking water has been or is shrinking. David Zetland’s book tries to tackle this problem from an economic perspective.
… the real solution to the end of abundance requires that people abandon hard-won traditions that embody decades of distilled experience in exchange for novel ideas and unknown future benefits. A stable institution from one perspective may be rigid from another perspective, but institutions need to evolve with circumstances. In the case of water, good institutions prevent shortage, allowing valuable uses today while saving for tomorrow. Bad institutions make shortage more likely; they can turn abundance into scarcity faster than you can say empty reservoir. What forces a water manager to change the way his organization manages its water? Not much. In most parts of the world, water service is provided by a monopoly, which means each organization chooses how to serve its local customers without fear of competition. […] The end of abundance means water managers […] need to either increase supply or reduce demand. Although additional supply can be expensive, the bigger headache comes from allocating the cost of new supply among customers who claim others should pay more. Reducing demand is even harder, since it requires rationing.

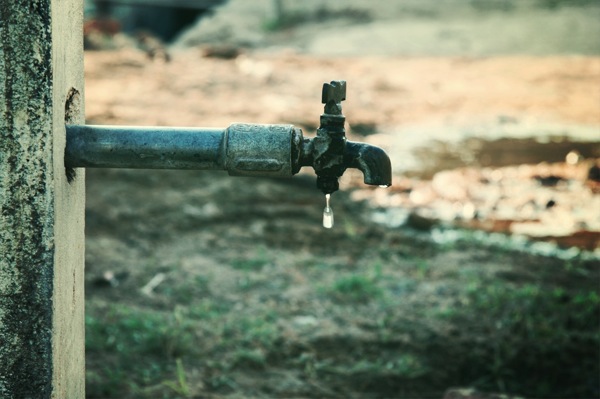
Photo by VinothChandar – http://flic.kr/p/7Jcr9c
Changing a current situation, or changing a current behaviour is difficult. The situation regarding availability of drinking water might be comparable to the problem of climate warming. Some people say capitalism is not useful to lead to necessary change or else the effects of climate change are too detrimental. David Zetland’s book offers some useful thoughts of how thinking along some economic principles might lead to change. I do think that it is not along “big” economic concepts such as free trade or financial speculation. Zetland’s thoughts are more along the lines of local economics. I would even go as far as saying that his economic thoughts are as simple as thinking through scenarios of what could happen if I paid that amount or an extra amount on the good x at time t , and not a different amount on a different good. This approach gets interesting, when you’re trying to think about the effects on other goods or the same good at different times, at different locations.
David Zetland even writes that such a locally-based approach
[…] reflects water’s local origins and the difficulty of transporting water over long distances. Good water management requires that one understand local customs and solutions while looking for outside ideas that can be modified and implemented with a creativity that drives at the goal while bending to social, economic and political realities.
This might be the reason why these economic principles are explained with fairly simple graphs. Still, this type of thinking helps to think into different directions that might be useful in the attempt to avoid shortages. When do such shortages occur? David Zetland defines the end of abundance multiple times:
- The end of abundance is the same as the beginning of scarcity, but scarcity (falling supply and increasing demand) need not lead to shortage.
- The end of abundance for freshwater means we have to pay more attention to protecting our drinking water and the environment. Our definition of dirty is changing, our rules for discharge are changing, and our perspectives on local and distant are changing. Europeans try to reduce dirty water with regulations. Americans put more emphasis on market solutions (cap and trade of emissions) while also relying heavily on regulations. The end of abundance has a stronger impact on people in developing countries because they have less money and worse institutions
- The end of abundance (and rise of nasty chemicals) means sludge remaining after primary and secondary treatment is more of a liability than an asset.
- The end of abundance means prices based on cost need to be upgraded to include scarcity charges. Scarcity-based prices may not keep people from wasting water on lifestyle habits, but they will prevent shortages and ensure that people pay the full cost of their choices.
- The end of abundance means the supply side/cost recovery model of water management no longer delivers the results we want, but that model still dominates the business — from California to China, Florida to Fiji — and it will cause trouble until we change the way we manage
- Perhaps the greatest irony in the water business is that the solution to shortage — more supply — often comes from somewhere else at someone else’s expense. The end of abundance results when somewhere else runs out of water.
There are many beautiful thoughts in this book that are well worth a discussion. I am going to list three concepts related to water pricing that have been new to me and that I found very interesting:
- zero net tax (ZNT): consider, for example, an industry whose lobbyists argue against a tax on pollution — claiming that it will destroy jobs, kill babies, open the borders to invasion, and so on. Their lobbying can be overcome by replacing a tax per unit of pollutant with a “zero net tax” (ZNT) that works by measuring average pollution per unit of output, taxing companies that issue above-average pollution, and rebating those tax revenues to below-average polluters (taxes and rebates rise with distance from the average).
- “Some for Free”. The idea is based on four steps. First, every household pays a service charge equal to the fixed cost of the water connection. Second, the number of people in the household determines how many units of cheap (or free) water the house receives. Third, the price of additional units is set high enough to reduce demand and prevent shortages, not cover costs. Fourth, excess revenue is rebated per capita.
- Smart Meters: After installing meters, it’s important to think about how often customers see their bills. It’s hard to change behavior when water bills and usage statistics arrive quarterly or annually. Monthly billing is good, but real-time statistics on consumption and volumetric charges give the strongest signals to conserve. Smart meters that measure and display real-time consumption are more expensive to install and operate because they require wireless communications networks to relay data and replace older, simpler meters that last for 30–50 years
For this review I picked three examples that were interesting to me. The book is full of examples, that are worth reading, and would be worth discussing! The combination with the real-world water-related examples and some basic economic theory accomplishes the goal of how to gain and maintain that balance [between supply and demand] using economic tools to allocate scarce water in a way that minimizes costs, maximizes value and reflects local values. If I had a wish, than it would be to deepen the economic concepts a little more.
Details on the book:
The End of Abundance: economic solutions to water scarcity
by David Zetland
Discussion Sites – Where to Find Answers
It seems not so long ago that I learned the basics of latex on comp.text.tex (btw. Unison is an awesome newsreader). Then came google.groups, and then came just google.
However, recently, I found that a certain category of “search sites” has surfaced. Which seem to be more attractive than the good old usenet. Not sure why. Maybe it’s because you can collect “points”. There are two sites which I started to find interesting:
mathoverflow and stackExchange.
There are really interesting questions being asked and answered:
— What are the examples of situations where “randomizing” a problem (or some part of it) and analyzing it using probabilistic techniques yields some insight into its deterministic version? – see here
or
— What are the big problems in probability theory? – see here
At stackExchange there are even groups:
– stats “Cross Validated”
– scicomp “Computational Science” (Beta – that’s why it looks “sketchy”)
– apple
– tex (but don’t forget comp.text.tex!)
update Saturday; January 14, 2012:
Just shortly after I wrote this, I found out that there’s a little discussion taking place on math overflow about “the Gaussian”
update Sunday; February 12, 2012:
PyDev forums switched to StackOverflow
Identi.ca Weekly Updates for 2012-01-11
- crowd source your #science hire a #lab if you don't have one http://t.co/lnrbsyky #
- Applied #hydromechanics in #GoogleEarth Phase Interference along a coastline, for example. http://t.co/c2v778Up #
- cool way to explore #SanFrancisco http://t.co/73nFrXh2 #
Identi.ca Weekly Updates for 2012-01-04
- Fresh thoughts on #python – "python for humans": pragmatic solutions http://t.co/SzNehRb0 #
- One of the "best science videos 2011" http://t.co/KqH5dJkd: "bad project" http://t.co/5ZQbYEtJ #
- #Predict 2012 with awesome Calvin and Hobbes http://t.co/NMYijxQG – Happy 2012! #
- #python (incl. #numpy anywhere? YES! @pythonanywhere – in your browser, from your smartphone. http://t.co/Y2ejEJUx #
- big #data "nearly all sectors in the U.S. economy had at least an average of 200 terabytes of stored data" http://t.co/6NZENoKg #
- Are dramatic losses such as due to recent flooding in Bangkok to happen more frequently in future? http://t.co/4u5wXQXm #
- @TheEconomist has sorted through the economy this year and selected nine charts that sum up 2011 http://t.co/3UK6DrgM” #